
Beyond top: how process states work
Linux process management is more than a binary choice between running or stopped. A process moves through several states that dictate how it interacts with the CPU and memory. Grasping these states is the first step toward tuning a system that feels sluggish despite low CPU usage.
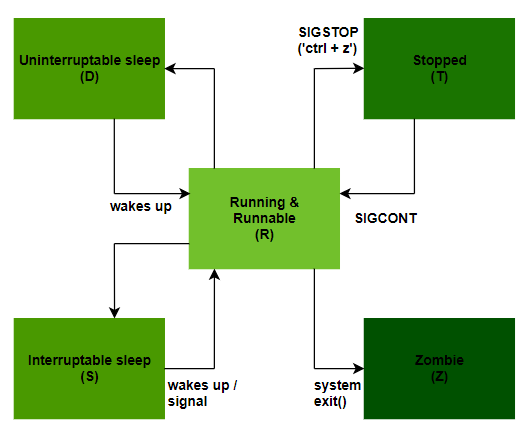
The core states you need to know are running, sleeping, stopped, and zombie. A running process is actively using the CPU. A sleeping process is waiting for an event – like I/O completion or a signal. Stopped processes are usually paused by a signal (like SIGSTOP) and can be resumed. Finally, a zombie process is one that has finished execution but still has an entry in the process table, waiting for its parent to reap its status.
Why does this matter? Because a large number of processes in a sleeping state might indicate I/O bottlenecks. A lot of stopped processes suggest someone has been experimenting with signals. And zombie processes, while generally harmless in small numbers, can indicate a problem with a parent process not properly cleaning up after its children. You can view process states using tools like `ps auxf` or `top`, but the key is knowing what those states mean.
Spotting resource bottlenecks
Okay, enough theory. Let's talk about finding the processes that are actually causing problems. `top` is the classic tool for this, but honestly, I prefer `htop`. `htop` offers a more visually appealing and interactive interface, making it easier to sort processes by CPU usage, memory consumption, or I/O activity. It’s a small change, but it makes a big difference in day-to-day use.
Beyond the headline numbers, pay attention to the difference between resident memory (RAM actually being used) and virtual memory (the total address space allocated to a process). A process with a large virtual memory footprint doesn’t necessarily mean it’s a problem, but a process consuming a huge amount of resident memory is definitely worth investigating. I’ve seen database servers slowly grind to a halt because of memory leaks, and web servers become unresponsive due to runaway logging.
Another useful tool is `vmstat`. It provides a broader system-level view, showing CPU usage, memory statistics, I/O activity, and more. It's particularly helpful for identifying I/O bottlenecks. It’s not always the process using the most CPU that’s the culprit; sometimes, it’s a process constantly waiting for disk access. Look for high values in the 'wa' (wait) column in `vmstat` output.
Nice values and process priority
The 'nice' value is a way to influence the priority of a process. It ranges from -20 (highest priority) to 19 (lowest priority). A lower nice value means the process gets more CPU time. You can use the `renice` command to adjust the nice value of running processes. It’s a surprisingly powerful tool, but it’s not a silver bullet.
It's important to understand that nice values only come into play when the system is under load. If there's plenty of CPU time available, all processes will get their fair share regardless of their nice value. Also, normal users can only increase the nice value of their own processes (make them less of a priority); decreasing it requires root privileges.
I’ve seen systems brought to a standstill by someone experimenting with real-time scheduling (nice value -20). Unless you really understand the implications, avoid using real-time priorities. They can easily starve other critical processes and cause instability. It’s generally best to stick to the standard nice range.
Nice Value, Priority, and Scheduling Impact in Linux
| Nice Value | Priority | Scheduling Impact | Typical Use Case |
|---|---|---|---|
| -20 | 0 | Highest Priority | Critical system processes, real-time applications (use with caution) |
| -10 | 10 | High Priority | Important background processes requiring responsiveness |
| 0 | 20 | Default Priority | Standard user applications and most processes |
| 5 | 25 | Slightly Lower Priority | Background tasks that shouldn't heavily impact interactive performance |
| 10 | 30 | Lower Priority | Less critical background processes, such as data backups |
| 15 | 35 | Significantly Lower Priority | Non-essential tasks, potentially impacting system responsiveness if CPU is heavily loaded |
| 19 | 39 | Lowest Priority | Very low priority processes; run only when system is idle |
Illustrative comparison based on the article research brief. Verify current pricing, limits, and product details in the official docs before relying on it.
Resource isolation with cgroups
Control groups (cgroups) are a much more sophisticated way to manage resources. They allow you to group processes and limit their resource usage – CPU, memory, I/O, and more. This is a game-changer for isolating workloads and preventing one process from monopolizing system resources.
You can create cgroups using tools like `cgcreate` and assign processes to them using `cgclassify`. Once a process is in a cgroup, you can set limits on its resource usage using `cgset`. For example, you could limit a specific process to 50% of a CPU core or 1GB of memory. This is a far more precise and reliable way to manage resources than relying on nice values alone.
Cgroups are also the foundation of containerization technologies like Docker and Kubernetes. These technologies use cgroups to isolate containers from each other and from the host system. Understanding cgroups is essential for anyone working with containers. While the initial setup can be a bit complex, the benefits in terms of resource management and isolation are well worth the effort.
- Create a group using cgcreate -g cpu,memory:/scripts to define which controllers to use.
- Assign processes to the cgroup.
- Set limits by writing values directly to files like cpu.max or memory.high within the cgroup directory.
Signals: The Sysadmin's Toolkit
Signals are how you communicate with processes. They’re a fundamental part of the Linux process model. The `kill` command is your primary tool for sending signals. Some of the most common signals include SIGTERM (termination request), SIGKILL (forced termination), SIGHUP (hangup – often used to reload configuration), SIGSTOP (pause), and SIGCONT (resume).
When you run `kill `, it sends a SIGTERM signal by default. This gives the process a chance to clean up and exit gracefully. However, if a process is unresponsive, you might be tempted to use `kill -9 ` (which sends SIGKILL). Be careful with SIGKILL! It doesn’t allow the process to clean up, which can lead to data corruption or other issues. Always try SIGTERM first.
Applications can also handle signals themselves, allowing them to respond to events in a controlled manner. Understanding signal handling is important for debugging and managing complex applications. I once spent a frustrating afternoon tracking down a bug caused by a process not correctly handling a SIGHUP signal.
Deep-dive monitoring with perf and bpftrace
For deep-dive performance analysis, `perf` and `bpftrace` are invaluable tools. `perf` is a powerful performance profiling tool that can help you identify hotspots in your code. `bpftrace` is a more recent tool that uses eBPF (extended Berkeley Packet Filter) to trace system calls and other events.
These tools have a steep learning curve, and they require a good understanding of system internals. However, the insights they provide can be worth the effort. You can use them to identify performance bottlenecks, optimize code, and diagnose complex issues. For example, you can use `perf` to see which functions are consuming the most CPU time, or `bpftrace` to trace the execution of a specific system call.
I’ll admit, mastering these tools takes time and effort. But they allow you to move beyond reacting to problems to proactively identifying and resolving them before they impact your users. They’re essential for any serious Linux performance engineer.
No comments yet. Be the first to share your thoughts!