
Basic connectivity checks
When things go wrong with a network, you need to start with the basics. That means `ping`, `traceroute`, and `netstat`. These commands are your initial reconnaissance tools. I’ve seen seasoned sysadmins spend hours on complex investigations only to find the problem was a simple routing issue, easily spotted with `traceroute`. Don’t underestimate the value of methodical checking.
Let’s start with `ping`. It’s the simplest way to check if you can reach a host. `ping google.com` will send ICMP echo requests to Google’s servers and report the response time. If you get "Destination Host Unreachable’ or ‘Request timed out’, you have a connectivity problem. `traceroute` (or `tracepath`, which doesn"t require root) then shows you the path packets take, identifying where the connection is failing. This is invaluable for pinpointing network bottlenecks or misconfigured routers.
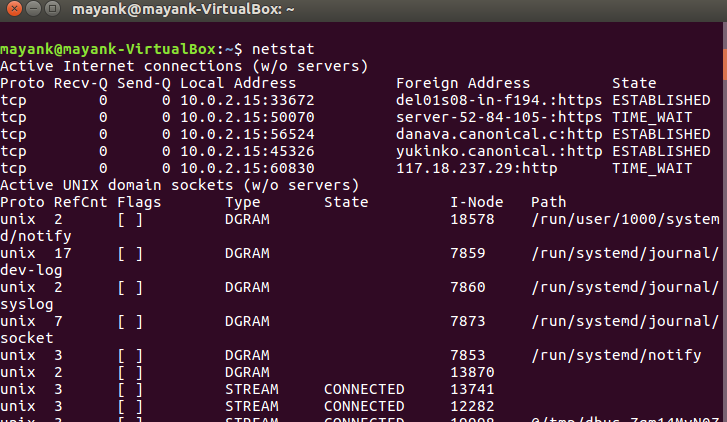
Finally, `netstat` – though increasingly superseded by `ss` – is still useful for a quick overview of network connections. `netstat -tulnp` lists all listening and established TCP and UDP ports, along with the process ID (PID) associated with each connection. Knowing which processes are listening on which ports is essential for security and troubleshooting. I often use this to quickly verify if a service is actually listening on the expected port.
A habit I’ve developed is to always check the physical layer first. Is the cable plugged in? Is the network interface up? It sounds basic, but you’d be surprised how often the problem is that simple. Before diving into complex commands, eliminate the obvious.
The ip command
The `ip` command is the modern workhorse for network configuration and troubleshooting in Linux. It’s much more powerful and flexible than the older tools like `ifconfig` and `route`, but that power comes with complexity. Don’t try to learn everything at once; focus on the subcommands you use most often.
`ip addr` shows you the IP addresses assigned to your network interfaces. The output can be a bit dense, but pay attention to the `state` field – "UP’ means the interface is active, ‘DOWN’ means it"s not. `ip route` displays the routing table, which determines where packets are sent. Understanding the routing table is crucial for diagnosing connectivity issues. `ip link` manages network interfaces, allowing you to bring them up or down, change their MAC address, and more.
A useful trick is to use `ip addr show` to get a more concise output of interface addresses. I also find `ip route show default` particularly helpful for quickly identifying the default gateway. Don’t overlook the `-4` and `-6` options to filter output for IPv4 and IPv6 addresses respectively. These can declutter the output significantly when you’re dealing with dual-stack networks.
There are a lot of less commonly used options within the `ip` command, and it can be a bit overwhelming to learn them all. But focusing on `addr`, `route`, and `link` will get you 90% of the way there.
Socket statistics with ss
If you’re still relying on `netstat`, it’s time to switch to `ss`. It’s faster, more efficient, and provides a wealth of information about network sockets. `ss` directly accesses kernel socket statistics, making it significantly quicker than `netstat`, which parses `/proc` files. This performance difference is especially noticeable on busy servers.
The basic command, `ss -tulnp`, is similar to `netstat -tulnp`. It shows TCP (`-t`), UDP (`-u`), listening (`-l`), numeric (`-n`) addresses and ports, and process IDs (`-p`). You can filter the output using various options. For example, `ss -t state established` shows only established TCP connections. `ss -s` provides a summary of socket usage, which is helpful for identifying potential bottlenecks.
Combining `ss` with `grep` is a powerful technique. For instance, `ss -tulnp | grep :80` will show all processes listening on or connected to port 80. This is great for quickly identifying which application is using a specific port. I've saved myself hours of debugging with this simple combination.
There’s a bit of a learning curve with `ss`, as the output format is different from `netstat`. But the performance benefits and detailed information it provides make it well worth the effort. I recommend spending some time experimenting with different options to get comfortable with the command.
- ss -tulnp: Lists listening and established UDP/TCP connections with their PIDs.
- `ss -t state established`: Shows only established TCP connections.
- `ss -s`: Displays a summary of socket usage.
Essential ss Command Examples for Network Analysis
The ss command has become the modern replacement for netstat in Linux network troubleshooting. It provides faster performance and more detailed information about socket connections. Here are three fundamental ss commands that every sysadmin should master:
# Display all listening and established connections with process information
ss -tulnp

# Show network statistics summary
ss -s

# Filter connections by state and port (HTTP/HTTPS traffic)
ss -o state established '( dport = :http or dport = :https )'
The first command uses multiple flags: -t shows TCP sockets, -u displays UDP sockets, -l lists only listening sockets, -n prevents hostname resolution for faster output, and -p shows the process using each socket. The second command provides a quick overview of network statistics including total connections by protocol. The third command demonstrates advanced filtering by combining the -o flag for additional socket information with state filtering to show only established HTTP and HTTPS connections.
Digging Deeper with `tcpdump`
When you need to analyze network traffic at the packet level, `tcpdump` is your go-to tool. It allows you to capture and inspect network packets, providing a detailed view of what's happening on the wire. However, with great power comes great responsibility – and a lot of data. Using `tcpdump` without filters can quickly overwhelm you.
The basic command, `tcpdump -i eth0`, captures all traffic on the `eth0` interface. You can filter the output by IP address (`host 192.168.1.1`), port (`port 80`), and protocol (`tcp` or `udp`). For example, `tcpdump -i eth0 host 192.168.1.1 and port 80` captures only TCP traffic to or from the host with IP address 192.168.1.1 on port 80. The `-n` option prevents reverse DNS lookups, which can speed up capture.
Interpreting the output can be challenging, but understanding the basic packet structure is helpful. The output shows the timestamp, source and destination IP addresses and ports, protocol, and a hexadecimal dump of the packet data. Tools like Wireshark can provide a graphical interface for analyzing `tcpdump` captures, making it easier to understand the data.
Remember that capturing network traffic can raise privacy concerns. Only capture traffic that you are authorized to inspect, and be mindful of sensitive data. It's also a good practice to limit the capture duration and filter the traffic as much as possible to reduce the amount of data collected.
DNS diagnostics
DNS issues are a surprisingly common cause of network problems. Incorrect DNS settings can lead to website resolution failures, email delivery issues, and other connectivity problems. Fortunately, Linux provides several tools for diagnosing DNS issues.
`nslookup` is a simple tool for querying DNS servers. `nslookup google.com` will return the IP address associated with the domain name `google.com`. It's easy to use, but it's considered somewhat outdated. `dig` is a more powerful and flexible DNS query tool. `dig google.com` provides more detailed information, including the DNS server used, the query time, and the DNS records returned.
I often use `dig +trace` to trace the DNS resolution process, starting from the root DNS servers and following the chain of delegation. This can help identify which DNS server is failing to resolve the domain name. `dig -x ` performs a reverse DNS lookup, resolving an IP address to a domain name.
I’ve lost countless hours chasing phantom network problems that turned out to be DNS related. Learning to use `nslookup` and `dig` effectively is a valuable skill for any sysadmin. Don’t overlook the importance of verifying your DNS settings.
Firewall Checks: `iptables` and `nftables`
Firewalls are essential for network security, but they can also block legitimate traffic, causing connectivity issues. Understanding how to inspect and manage firewall rules is crucial for troubleshooting network problems. Modern Linux distributions are increasingly using `nftables` as the default firewall backend, but `iptables` is still widely used.
`iptables -L` lists the current firewall rules. The output can be complex, but it shows the chain (INPUT, OUTPUT, FORWARD), the rule number, the source and destination IP addresses and ports, and the action (ACCEPT, DROP, REJECT). `nftables` uses the `nft list ruleset` command to display the ruleset. The syntax is different from `iptables`, but the concept is the same.
To check for dropped packets, use `iptables -nvL` (for numeric values and verbose output) or `nft list chain inet filter input` (for `nftables`). This will show you how many packets have been dropped by each rule. Be extremely careful when modifying firewall rules, as you could accidentally lock yourself out of the server. Always test changes in a non-production environment first.
Temporarily disabling a rule for testing can be helpful, but be sure to re-enable it afterward. The `iptables -D ` command deletes a specific rule. With `nftables`, you'll need to flush the entire table or chain to remove all rules. Remember, security is paramount, so don’t leave the firewall disabled for long.
Looking toward 2026
Looking ahead to 2026, the landscape of network troubleshooting will continue to evolve. I think mastering `ebpf` (Extended Berkeley Packet Filter) for network observability will be increasingly important. `ebpf` allows you to run sandboxed programs in the kernel, enabling deep packet inspection and performance analysis without the overhead of traditional packet capture.
It’s a complex technology, but the potential benefits are huge. It allows for very granular monitoring and analysis of network traffic. I also expect to see more emphasis on automation and scripting these commands for proactive monitoring and remediation. As networks become more complex, relying on manual troubleshooting will become unsustainable.
Tools that integrate with `ebpf` and offer automated analysis will be highly valuable. The ability to correlate network data with application performance metrics will be critical for identifying and resolving issues quickly. Staying ahead of the curve in these areas will be essential for any sysadmin in 2026.
Linux Network Monitoring Tools Comparison - 2026
| Tool | Real-time Traffic Display | Per-Interface Monitoring | Resource Usage | Complexity |
|---|---|---|---|---|
| nload | Excellent visual display | Supports individual interface selection | Generally low | Simple to use |
| iftop | Focuses on connections, displays bandwidth per connection | Designed for per-interface monitoring | Moderate | Moderate - requires understanding of network connections |
| bmon | Comprehensive, customizable display | Detailed per-interface statistics | Moderate to Higher | More complex configuration options |
| vnstat | Logs traffic over time, provides reports | Per-interface monitoring via configuration | Very Low | Simple configuration, report focused |
| tcpdump | Packet capture and analysis (not a direct display) | Can filter by interface | Moderate to High - depends on filters | High - requires understanding of network protocols |
| sar (system activity reporter) | Reports historical network data | Can report per-interface statistics | Low to Moderate | Moderate - requires understanding of sar's reporting format |
| netstat | Displays network connections, routing tables, interface statistics | Provides interface-specific data | Low | Relatively simple for basic use, more complex for advanced analysis |
Qualitative comparison based on the article research brief. Confirm current product details in the official docs before making implementation choices.
No comments yet. Be the first to share your thoughts!