
System load is more than cpu usage
Blaming the CPU is the default reaction when a server crawls, but high utilization is often just a symptom or even expected behavior for a busy node. I've seen plenty of systems with 90% CPU usage that are perfectly healthy. You have to look at the interplay between load averages, memory pressure, and disk I/O to find the actual bottleneck.
Load average, displayed as three numbers representing the average system load over the last 1, 5, and 15 minutes, is a good starting point. It reflects the number of processes waiting to run. A load average equal to the number of CPU cores is generally acceptable; higher values suggest congestion. CPU utilization breaks down into user, system, idle, and I/O wait time, giving you a clearer picture of where the CPU is spending its cycles.
Memory usage is also critical. While 'free' memory seems desirable, Linux actively caches data in unused memory to speed up access. Therefore, low 'free' memory isn't necessarily bad. Instead, pay attention to 'used' memory, swap usage, and the amount of memory being used for buffers and cache. Excessive swap usage indicates the system is running out of physical memory, which will severely impact performance.
Finally, disk I/O can be a major bottleneck. Slow disks or high disk activity can bring a system to its knees. Context switching, the rate at which the kernel switches between processes, is another important metric. A high rate can indicate the system is spending too much time managing processes rather than executing them. It's a sign of overall system stress.
Command-line tools for real-time monitoring
While `top` is the standard default on every distro, I almost always install `htop` immediately. It’s interactive, the color-coding makes process states obvious at a glance, and you can scroll vertically or horizontally without losing your mind. It’s a better way to see where your cycles are going in real-time.
`vmstat` reports on virtual memory statistics, including process activity, memory usage, and I/O. `iostat` focuses specifically on disk I/O, showing you read/write speeds and utilization. `df` displays disk space usage, while `free` provides a detailed breakdown of memory usage. These tools are often used in combination to get a comprehensive picture of system performance.
For example, if `top` shows high CPU usage, you might use `vmstat` to see if the system is spending a lot of time swapping. If `iostat` shows high disk I/O, you might use `df` to see if you’re running out of disk space. Learning to correlate the output of these tools is a crucial skill for any Linux administrator.
A helpful trick is to use `top` or `htop` with the `-d` flag for a delay in seconds. This lets you slow down the refresh rate so you can more easily observe the changing values. Experiment with different refresh rates to find what works best for you. Don’t be afraid to hit "h" within `top` or `htop` to view the help screen and learn about available commands.
- top shows a live view of system processes and resource usage.
- htop is an interactive process viewer with color-coded output.
- vmstat: Virtual memory statistics.
- iostat: Disk I/O statistics.
- df: Disk space usage.
- free: Memory usage.
Interactive Process Monitoring with htop
The htop command provides an enhanced, interactive interface for monitoring system processes in real-time. Unlike the traditional top command, htop offers color-coded output, mouse support, and intuitive keyboard shortcuts for filtering and sorting processes. Here are the essential htop operations for performance monitoring:
# Basic htop usage
htop

# Filter processes by specific user (press 'u' in htop, then select user)
# Or launch htop and use interactive filtering:
# Press 'u' -> select username from list

# Alternative: Use top with user filtering
top -u username

# Sort processes by CPU usage in htop:
# Press 'P' (uppercase) to sort by CPU percentage
# Press 'M' (uppercase) to sort by memory usage
# Press 'T' (uppercase) to sort by time

# Command line alternatives for CPU monitoring
# Show top 10 CPU-consuming processes
ps aux --sort=-%cpu | head -11

# Monitor specific user's processes sorted by CPU
ps -u username --sort=-%cpu

# Real-time process monitoring with watch
watch -n 1 'ps aux --sort=-%cpu | head -10'
These htop filtering and sorting options allow you to quickly identify resource-intensive processes and monitor specific users' activities. The interactive nature of htop makes it particularly useful for real-time system analysis, as you can dynamically change sorting criteria and apply filters without restarting the command. For automated monitoring scripts, the ps command alternatives provide scriptable options that can be integrated into performance monitoring workflows.
Sifting through logs with journalctl
`journalctl` is the central tool for accessing and analyzing system logs in modern Linux distributions that use systemd. Unlike older log files, `journalctl` stores logs in a binary format, making them more efficient and easier to query. It's a powerful tool, but can be overwhelming at first.
The basic command, `journalctl`, displays all logs. However, you'll quickly want to learn how to filter them. `journalctl -t ` filters logs by service name (e.g., `journalctl -t sshd`). `journalctl --since “2026-01-01”` filters by date. `journalctl -p err` displays only error messages. Combining these options allows for highly specific log searches.
To track down the root cause of a slowdown, start by looking for error messages or warnings around the time the problem occurred. Pay attention to logs from services that might be involved. For example, if a web server is slow, check the logs for the web server, the database server, and any related services.
A useful feature is `journalctl -f`, which follows the logs in real-time, similar to `tail -f`. This is great for monitoring a service as you make changes or troubleshoot issues. Remember to use `journalctl --disk-usage` to check the size of the journal and prevent it from filling up your disk.
- journalctl: Access and analyze system logs.
- journalctl -t : Filter logs by service name.
- journalctl --since : Filter logs by date.
- journalctl -p : Filter logs by priority (e.g., err, warn, info).
- journalctl -f: Follow logs in real-time.
Tracking network performance
A slow network can cripple an otherwise powerful system. Monitoring network activity is essential for identifying bottlenecks and diagnosing connection problems. `iftop` displays a real-time view of network bandwidth usage by connection, similar to `top` but for network traffic. It's great for identifying which hosts are consuming the most bandwidth.
`tcpdump` is a powerful packet sniffer that allows you to capture and analyze network traffic. It's a more advanced tool, but can be invaluable for troubleshooting complex network issues. `netstat` and its modern replacement, `ss`, display network connections, routing tables, and interface statistics. `ss` is generally faster and provides more information.
To identify network bottlenecks, use `iftop` to see which connections are using the most bandwidth. If you suspect packet loss, use `tcpdump` to capture packets and analyze them for errors. `netstat` or `ss` can help you identify connection issues, such as dropped connections or refused connections.
Don't overlook DNS resolution as a potential bottleneck. Slow DNS lookups can significantly impact performance. Tools like `dig` and `nslookup` can help you diagnose DNS problems. Regularly checking DNS resolution times can prevent frustrating slowdowns.
Advanced Profiling with perf
For a deeper understanding of performance bottlenecks, `perf` is a powerful tool. It allows you to profile CPU usage, identify hotspots in your code, and understand how your applications are interacting with the kernel. However, it has a steeper learning curve than the tools we’ve discussed so far.
The basic command, `perf record`, starts recording performance data. You can specify the program to profile using the `-g` flag to enable call graph recording. After recording, use `perf report` to analyze the data. This will show you which functions are consuming the most CPU time.
Profiling system-wide performance is also possible with `perf top`, which displays a real-time view of CPU usage by function. This is a great way to identify system-level bottlenecks. Be aware that `perf` requires root privileges to access certain performance counters.
Interpreting `perf` output can be challenging. It often requires a good understanding of the application’s code and the kernel’s internal workings. However, the insights it provides can be invaluable for optimizing performance. The `perf` documentation is extensive, and there are many online tutorials available.
- perf record: Record performance data.
- perf report: Analyze performance data.
- perf top: Display real-time CPU usage by function.
Long-Term Monitoring with Prometheus and Grafana
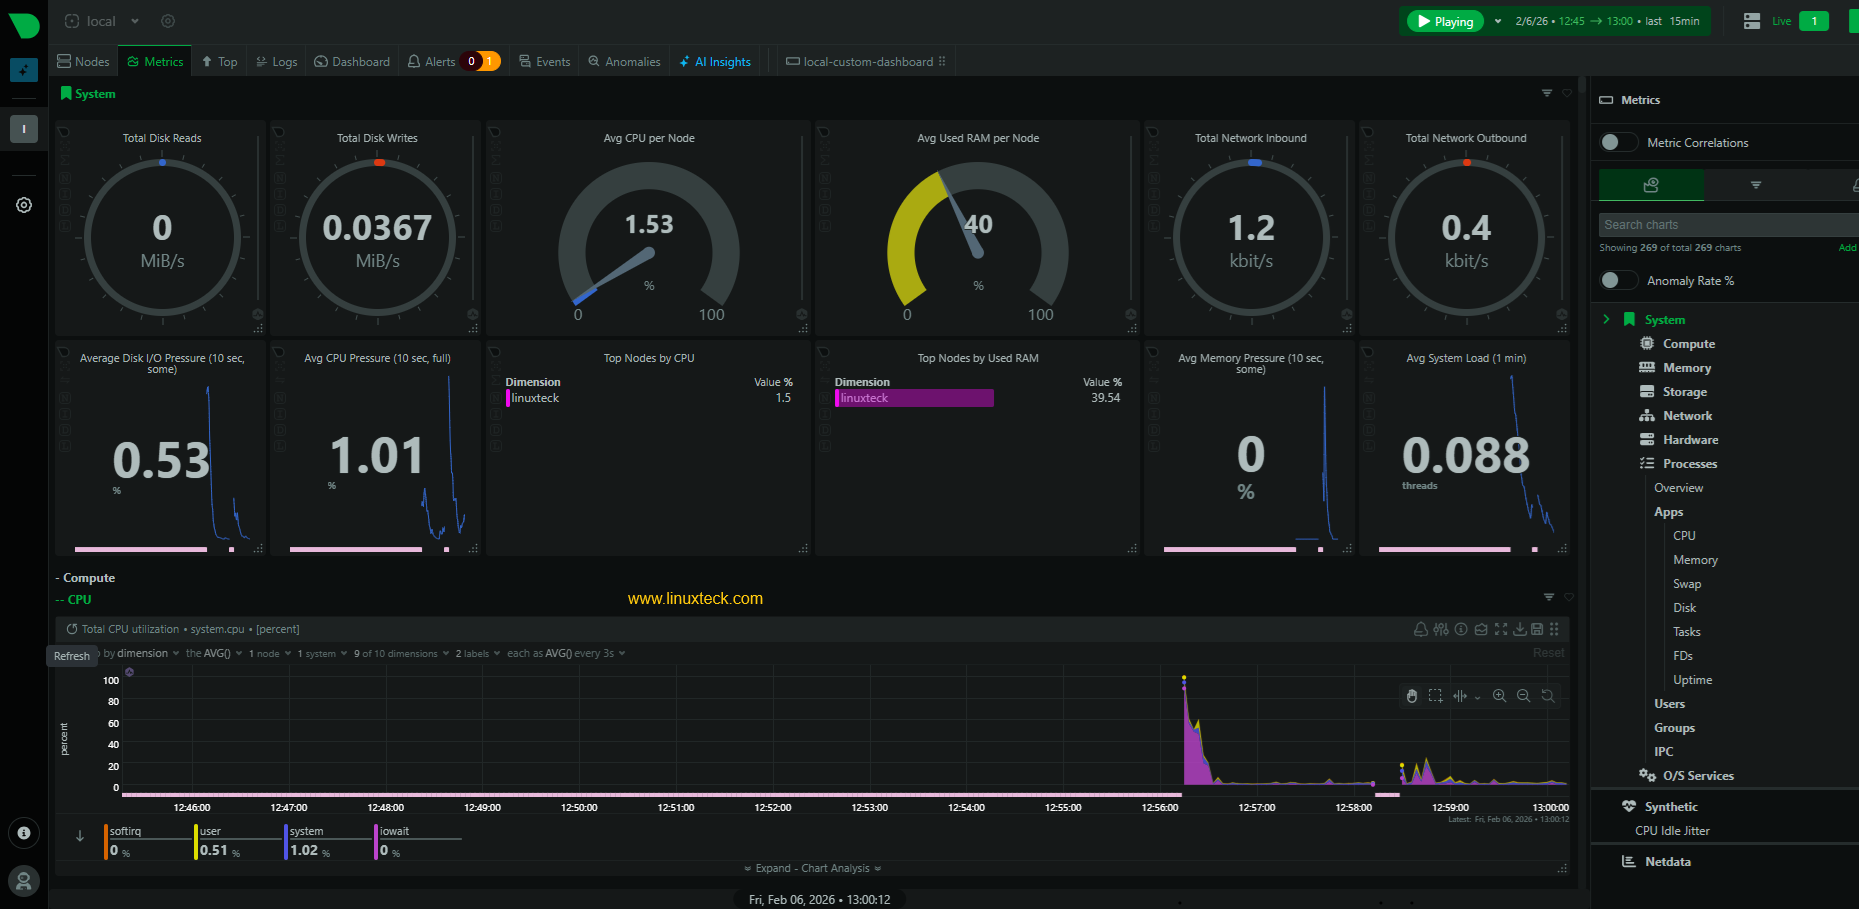
Real-time tools are essential for immediate troubleshooting, but long-term monitoring is crucial for identifying trends and preventing problems before they impact users. Prometheus and Grafana are popular open-source tools for this purpose. Prometheus collects system metrics, while Grafana visualizes that data.
Setting up Prometheus involves installing the Prometheus server and configuring it to scrape metrics from your systems. Node Exporter is a common agent used to collect system metrics and expose them to Prometheus. Once Prometheus is collecting data, you can use Grafana to create dashboards that visualize the data.
There are many pre-built Grafana dashboards available for Linux performance monitoring. These dashboards typically include metrics like CPU usage, memory usage, disk I/O, network traffic, and more. You can customize these dashboards to meet your specific needs.
The combination of Prometheus and Grafana provides a powerful and flexible monitoring solution. It allows you to track performance over time, identify trends, and set alerts when performance thresholds are exceeded. This proactive approach can help you prevent problems and ensure the stability of your systems.
Spotlight on Clear Linux Performance Features
Intel’s Clear Linux distribution is specifically engineered for performance, particularly on Intel hardware. It achieves this through a number of optimizations, including a highly optimized compiler and kernel, and aggressive use of link-time optimization (LTO). LTO allows the compiler to optimize code across multiple files, resulting in faster execution.
Clear Linux also uses a rolling release model, meaning it receives frequent updates with the latest performance improvements. It’s built around the Yocto Project, which allows for fine-grained control over the system’s configuration. This level of customization can be beneficial for specific workloads.
Compared to other popular distributions like Ubuntu or Fedora, Clear Linux often exhibits superior performance in compute-intensive tasks. However, it may not be as user-friendly or have as wide a range of pre-built packages. It’s best suited for deployments where performance is paramount and a degree of technical expertise is available.
A key difference is Clear Linux’s focus on auto-tuning. The system dynamically adjusts its settings based on the workload, optimizing performance for the current task. This is particularly effective for workloads that vary over time. Consider Clear Linux if you are running demanding applications on Intel hardware and are willing to trade some convenience for maximum performance.
Linux Distribution Performance Comparison - 2026 Outlook
| Performance Area | Clear Linux | Ubuntu | Fedora |
|---|---|---|---|
| Boot Time | Generally Faster | Moderate | Moderate to Fast |
| Application Launch Speed | Often Quicker | Good, varies by application | Generally comparable to Ubuntu |
| Compilation Time | Strong Performance | Moderate | Good, benefits from recent optimizations |
| Memory Usage | Optimized, Lower | Moderate to Higher | Moderate |
| Package Management | Bundled Intel tools, specialized | APT - Wide Availability | DNF - Robust and Flexible |
| Desktop Environment Defaults | Minimal, geared towards server/developers | GNOME - Feature Rich | GNOME - Customizable |
| Out-of-the-Box Experience | Requires more configuration | User-Friendly | Good, improving with each release |
| Hardware Support | Optimized for Intel, good overall | Broad Hardware Support | Excellent Hardware Support |
Qualitative comparison based on the article research brief. Confirm current product details in the official docs before making implementation choices.


No comments yet. Be the first to share your thoughts!